- → Liam Reynolds
- → Bar Chart Visualization with Chart.js
Bar Chart Visualization with Chart.js
A customizable bar chart created with Chart.js library that visualizes data in a clear, readable format with hover effects and tooltips.
This Example is contributed by Liam Reynolds, on 30-Mar-2025. It is responsive. similar terms for this example are Admin Dashboard, User dashboard,Statistic,Data Visualization,Statistical Overview,Statistics Display,Stats,Info,Show info,Statistics

Author Liam Reynolds
Related Examples
-
 Data Card with Hover Effects
Engaging KPI card that displays key metrics with interactive hover effects and a progress bar.
10 months ago -
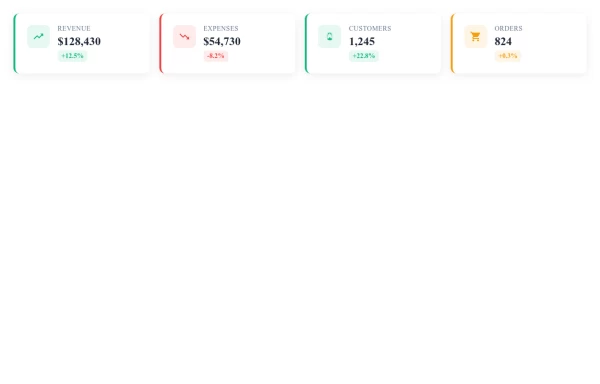
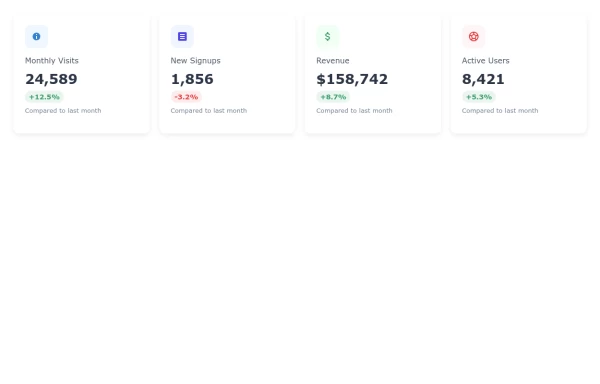
 Dashboard KPI Stat Cards with Icons
A collection of clean and responsive stat cards to display key performance indicators and metrics on dashboards, featuring customizable icons and color schemes.
8 months ago -
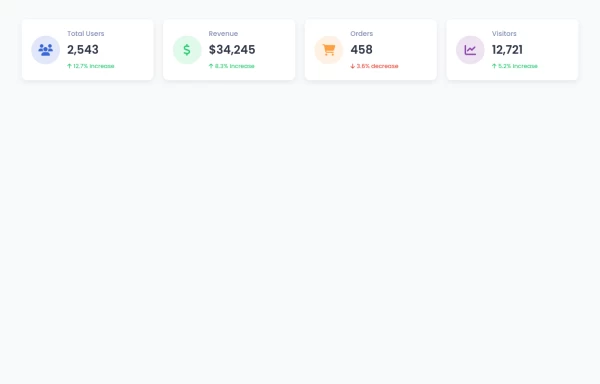
 Dashboard Statistics Cards
Responsive statistics cards with vibrant color schemes designed to highlight key performance indicators for data-driven applications.
9 months ago -
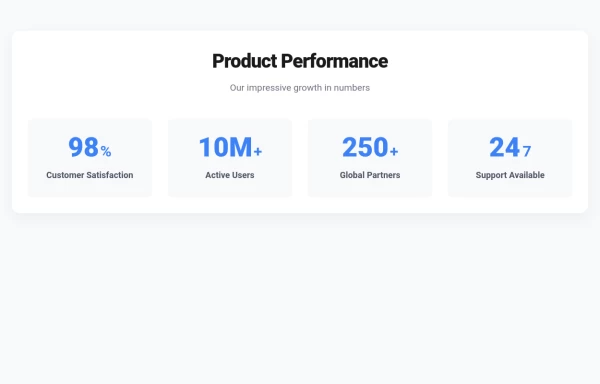 Bold Impact Stats Showcase for Product Metrics
A visually striking statistics component with bold typography and modern design to highlight your product's key performance metrics and achievements.
8 months ago -
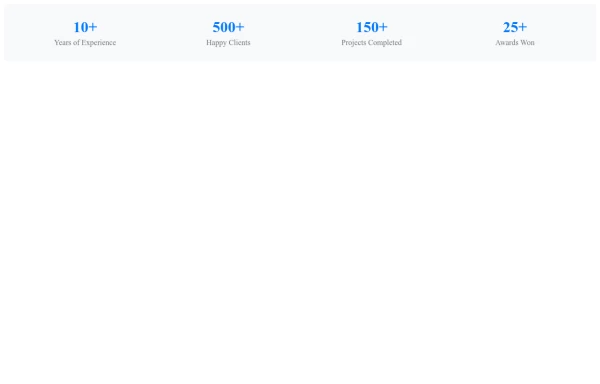 Key Metrics Overview
Showcase your expertise with key metrics, including years of experience, client satisfaction, project completion, and awards won.
9 months ago -
 KPI Blocks for Dashboard
Showcase your business metrics with this elegant KPI block group featuring trend indicators, percentages, and responsive design.
9 months ago -
 8 months ago
 -
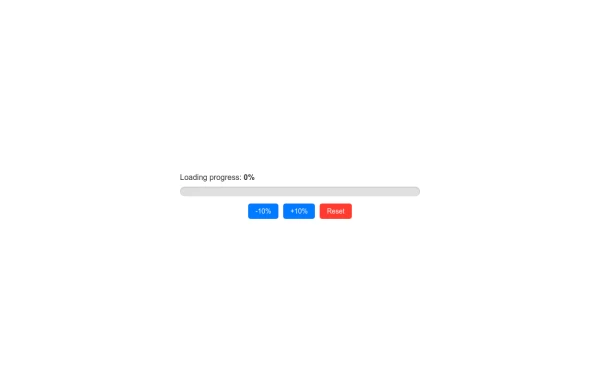
 Animated Skill Progress Bars
Visually represent your skills and expertise with these animated progress bars. Enhance your portfolio or resume with this dynamic and interactive component.
10 months ago -
 Flexible Info Cards with Stats Display
A set of clean information cards displaying key metrics and statistics with a simple hover effect for enhanced user experience.
8 months ago -
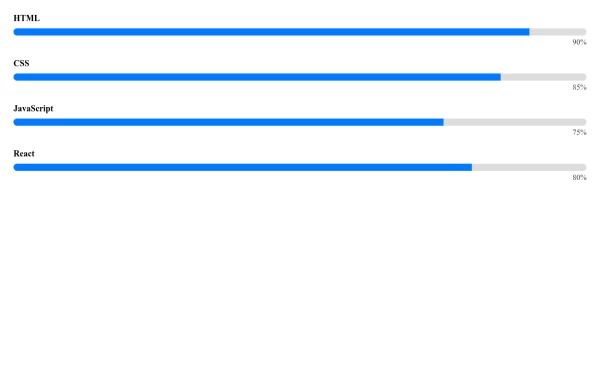 Skill Progress Bar
Showcase your skills with this interactive and animated skill progress bar. It features smooth animations and a clean, modern design, perfect for portfolios and resumes.
10 months ago -
 10 months ago
 -
 Dynamic Admin Dashboard Info Cards with Statistics
Modern, responsive admin panel info cards displaying key metrics and statistics with clean visuals for effective data monitoring.
9 months ago


Explore components by Tags
Didn't find component you were looking for?
Search from 500+ components